Suspension rate (2018-19) statistics from the California Department of Education are now available on RaceCounts.org at county and state levels. When a student is suspended, they lose valuable time in the classroom. In addition, suspensions and other punitive measures can criminalize youth and push them into the juvenile justice system. Overall, suspension rates have gone down in California due in part to a statewide ban on “willful defiance and disruption” suspensions in grades K-3. Some districts like LAUSD and Oakland Unified have gone further by banning them at all levels.
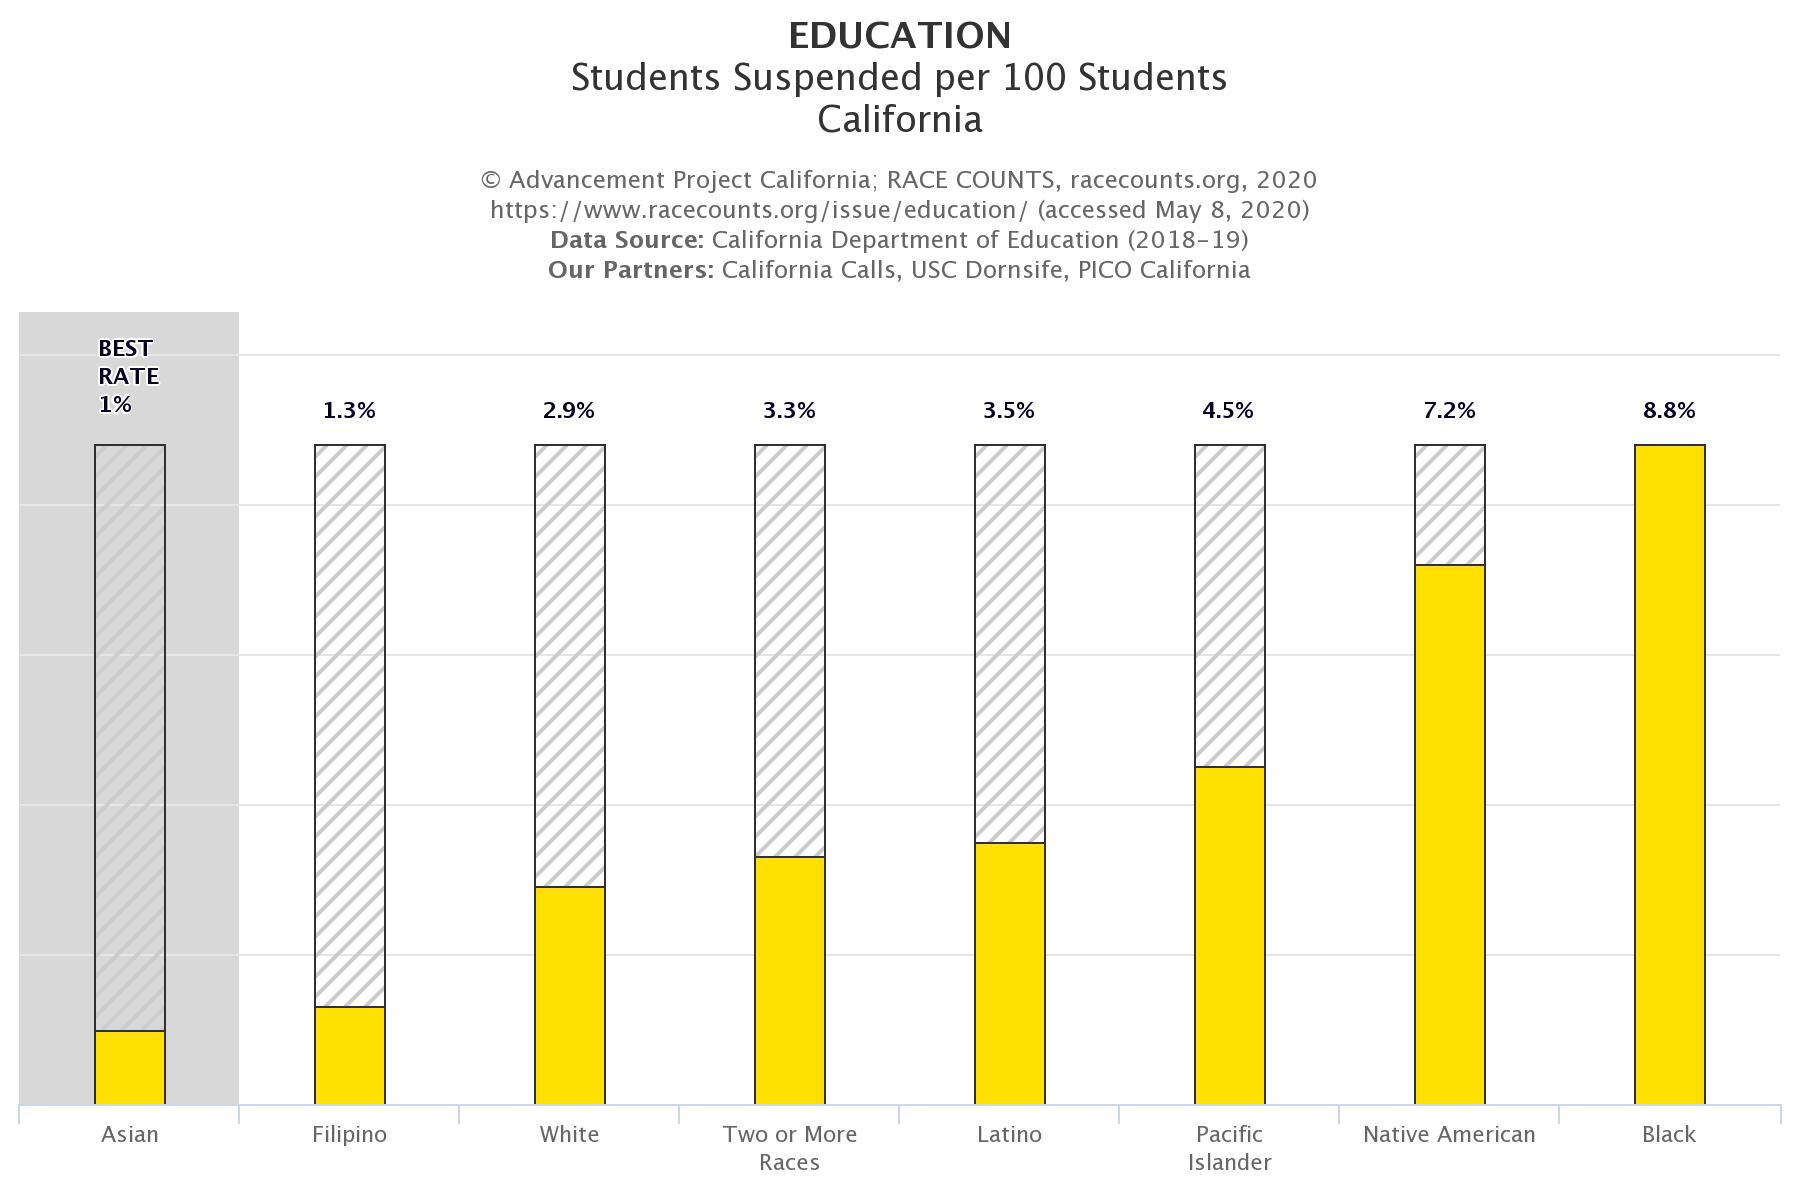
Performance: Alpine County had the highest suspension rate at 14.1%, more than four times the statewide rate (3.4%). The California Department of Education considers suspension rates above six percent as very high, three to six percent as high, one to three percent as medium, .5 to one percent as low, and below .5 percent as very low.
Disparity: San Luis Obispo County schools produced the most racially disparate suspension rates among all counties in the state. There, 7.7% of Black and American Indian/Alaska Native students and 4.9% of Latino/a students received suspensions. This means that students in these groups were 25 and 16 times respectively more likely to be suspended than the racial group with the best outcome.
Impact: California schools recorded 214,441 student suspensions in the 2018-19 school year. Latino/a students were the most impacted by suspensions, they made up 56% of all suspended students. Click here for data.