Indicators
Select an issue area and indicator and click GO to learn more about the indicators in RACE COUNTS. To find out how we calculate each of the indicators, view our Indicator Methodology. For even more information about RACE COUNTS data and methods, visit our RACE COUNTS GitHub repository.
Methodology
Race Counts measures performance, disparity, and impact in California counties to understand racial equity across seven key issue areas: crime and justice, democracy, economic opportunity, education, health access, healthy built environments, and housing. Indicators for each of the seven issue areas were selected after reviewing literature and meeting with on-the-ground experience.
Measuring performance and impact are straightforward. Performance is the rate of the total population for an indicator, issue area, or overall. For example, when we compare performance in high school graduation rates between Los Angeles and Orange counties, we are comparing their overall graduation rates. Impact is the size of the total population. Following this example, Los Angeles has a population of nearly 10 million people, more than three times the size of Orange, with a population of nearly 3.1 million people. All else being equal, expected impacts of disparities are thus expected to be larger in Los Angeles than Orange county based on population size.
Disparity is more complicated. Racial disparity is calculated in RACE COUNTS for two main reasons: to compare racial groups directly to one another (e.g., life expectancy of Blacks vs. Whites) and to summarize the overall level of disparity of all races for comparison across counties (e.g., disparity in high school graduation rates in Los Angeles and Orange counties). Since overall disparity summarizes direct racial group comparisons, the comparisons explain what drives overall disparity in a county.
Comparing Racial Groups
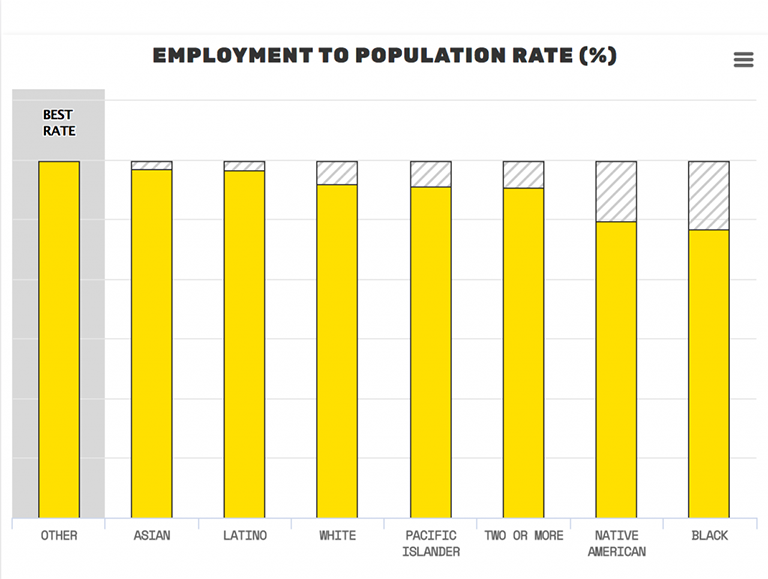
Racial groups are directly compared with a straightforward rate difference. To compare high school graduation rates of Blacks and Whites in a county would simply be subtracting the Black high school graduation rate from the White high school graduation rate, with a result of 0 implying total equity. In Figure 1, the rate difference between Blacks and Whites is 16% in Los Angeles County (86% – 70% = 16%).
Figure 1. Los Angeles County and California High School Graduation Rates
Summary Scores of Racial Disparity
We use a metric called the Index of Disparity (ID) to summarize overall equity in outcomes. The ID averages the absolute rate differences between group rates and a reference rate, and expresses it as a percentage of the reference rate (Pearcy and Keppel 2002, Harper et al. 2010, Harper 2011). RACE COUNTS uses the best rate as the reference rate for IDs to prioritize both equity and progress. Note: In rare cases where the “best” rate cannot be used because of data limitations, we have substituted the total population rate or the best non-zero rate. The Los Angeles County high school graduation ID is 13.8%. In other words, the average difference in high school graduation rates of each race from the best racial rate – the Asian graduation rate of 91.3% – is 13.8%. This is more than double Orange County’s high school graduation ID of 5.9%.
The ID is sensitive to how we “flip” the data (i.e., insured vs uninsured, employed vs unemployed). We will each make a call as the analyst “experts” on which is the best way to represent something, based on how it is used in the literature, what we think is helpful for this project, and also, based on how the indicator is understood and used publicly.
Rankings
To rank all 58 counties by performance and racial disparity, z-scores are calculated for county total values and IDs. Z-scores are capped for indicators and indexes to reduce the impact of extreme outliers. These z-scores are averaged across indicators to provide an aggregate score for each county by issue area and overall. (See Figure 2 for an example scatterplot of these z-scores.)
Figure 2. Scatterplot of Performance, Disparity and Impact
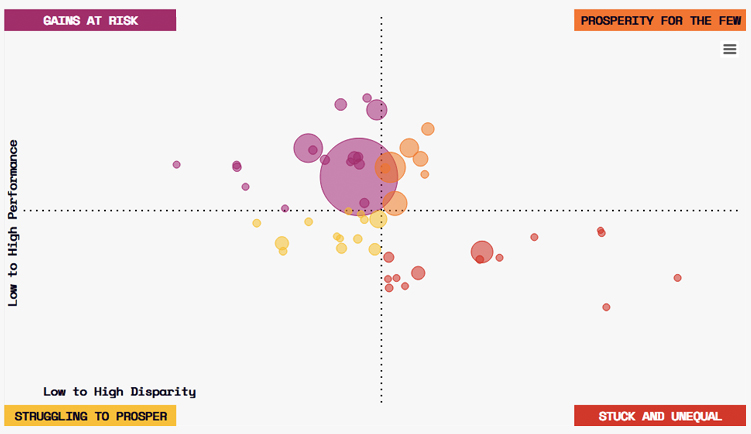
The results are visualized on scatterplots in which counties are colored by their relationship to performance and disparity county averages, and circles are sized by the size of county populations.
Counties where gains are at risk, depicted in purple have above average performance and below average disparity metrics.
Counties where prosperity is for the few, depicted in orange, have above average performance metrics and above average disparity metrics.
Stuck and unequal counties, depicted in red, have below average performance metrics and above average disparity metrics.
Counties struggling to prosper, depicted in yellow, have below average performance metrics and below average disparity metrics.
Key Limitations
This methodology has a number of limitations that are discussed at length in the limitations section of the full methodology, but a three are worth noting up front.
First race is incredibly intersectional and RACE COUNTS primarily focuses on the racial experience. Intersectional experiences related to class, immigrant status, and other population characteristics are largely absent from the performance, disparity, and impact calculations. Thus, the results hide important findings by class, immigrant status and more.
Second, RACE COUNTS primarily uses data at state and county levels. A fuller analysis of data at the city level is forthcoming, but as of November 2017, is largely missing. The results, therefore obscure important trends at sub-county levels, a number of which are highlighted in the analysis.
Finally, while RACE COUNTS is the most comprehensive compilation of data about racial equity by county in California, clear weaknesses in available data are evident. Data availability in the Democracy issue area was particularly challenging for less populous counties, and we rely on surname data to characterize race in three indicators. The availability of data by race at sub-state levels was challenging across the board, and we needed to create weighted averages to address this issue in some cases.